


SECOND QUARTER STATS—June 2020
ORLEANS PARISH
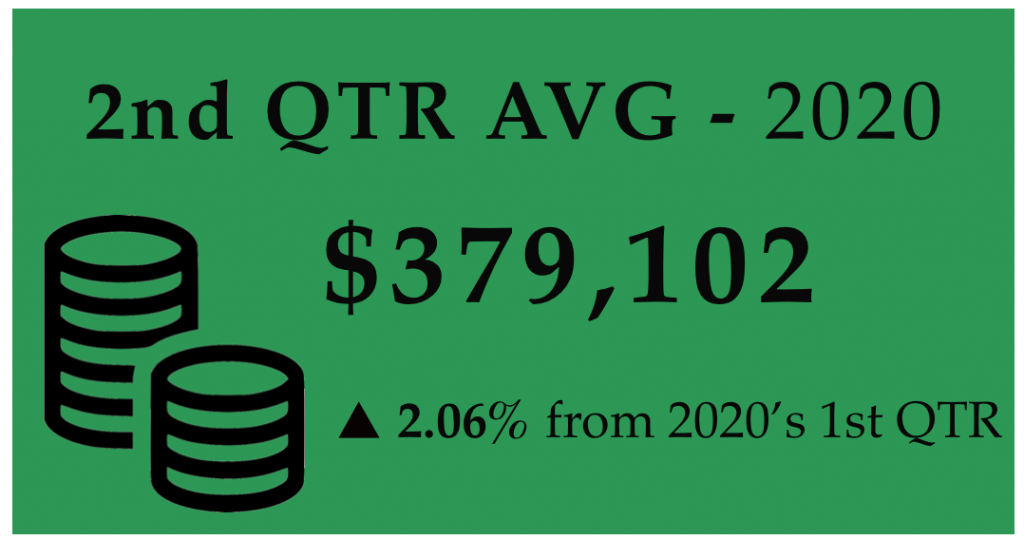
The 2nd Quarter of 2020 finished strong after its cautious rebound from last quarter’s COVID-19 start. The first two months in the 2nd Quarter could easily be mistaken for a prolonged Mardi Gras season as the real estate numbers were very reminiscent to the effects that Carnival season has on New Orleans real estate market. Refreshingly, buyers, sellers and real estate professionals became more confident in their buying and selling power in the last month of the 2nd Quarter. The Orleans Parish 2nd Quarter market maintained a couple of their numbers with 2019’s 2nd Quarter. The average sale price for Orleans Parish saw a slight increase from 2020’s 1st Quarter, inching up to an average sales price of $379,102 for detached residential homes in the 2nd Quarter. Resulting in making the 2nd Quarter in 2020’s average sale price a 2.06% upward tick from the 1st Quarter in 2020 and a 4.33% increase from 2019’s 2nd Quarter average sale price of $363,354.
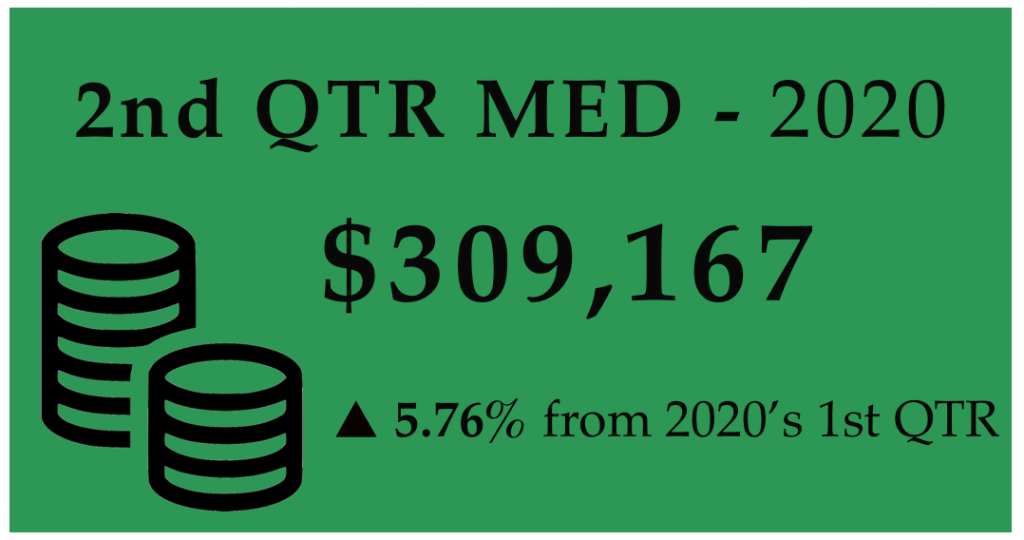
Additionally, the median sales price took an impressive 5.76% increase to $309,167 from the 1st Quarter $292,333 medium sales price. In 2019, the 2nd Quarter medium was $298,967 which is a 3.41% increase between this year and last year’s number.
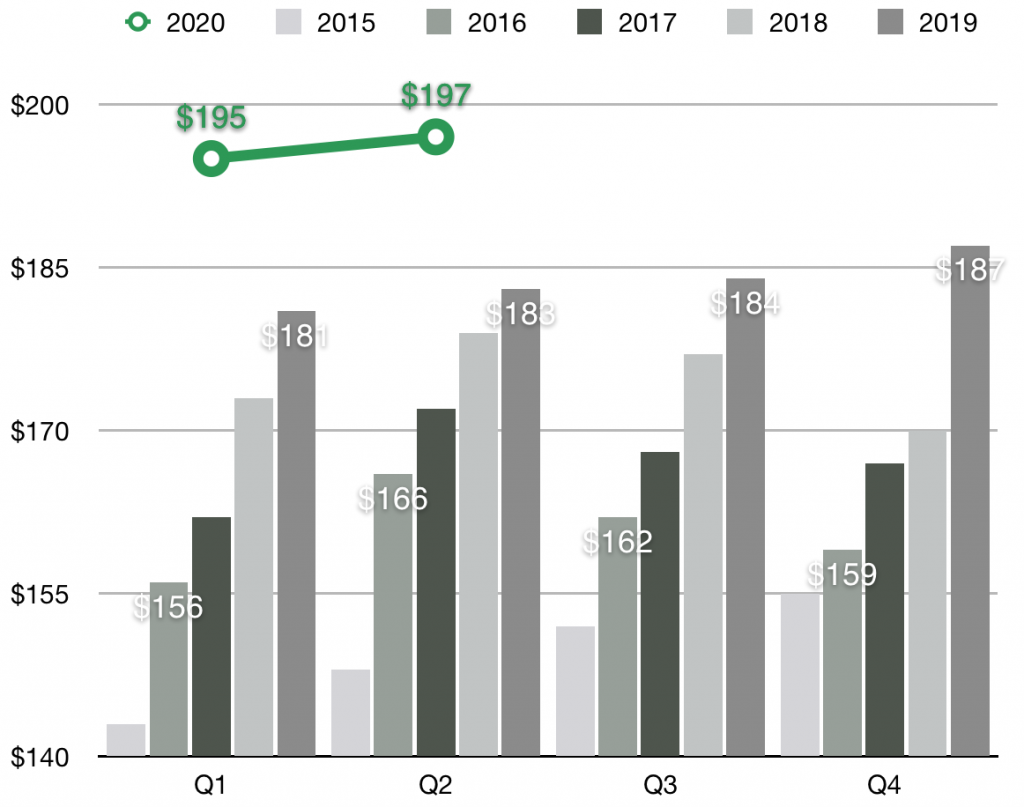
The 2nd Quarter saw the highest average per square foot price, resting at $197 for the Quarter. Impressively, May and June saw a record breaking $199 price per square foot in Orleans Parish.
The average days on market maintained in the 2nd Quarter with an average of 61 days on market while June finished the Quarter with a sluggish 78 days on market from list to close. The last time a month saw listings sitting on the market for a similar prolonged period was in February 2019 with an average of 71 days on market. Although, in March 2018 the average days on market was 85 days with the highest days on market being back in March 2014 with a whopping 94 days on market before selling.
TOTAL NO. OF NEW LISTINGS—YTD
The 2nd Quarter of 2020 saw the number for new active listings decline to an average of 388 new listings, a 5.83% decrease from the 1st Quarter in 2020. With only 307 new listings, April had the lowest amount of new listings, whereas May had 429 and June had 427 new listings respectfully.
Overall, it was a 19.83% decrease from 2019’s 2nd Quarter.

TOTAL RES UNITS SOLD—YTD

RES UNITS SOLD PRICE—YTD
PRICE PER SQUARE FOOT
Although the COVID-19 pandemic has put a slight damper on the overall real estate market, Orleans Parish saw the price per square foot maintain and increase.
The 2nd Quarter average increased to $197 per square foot with May and June seeing the average at an impressive and record setting $199 per square foot.
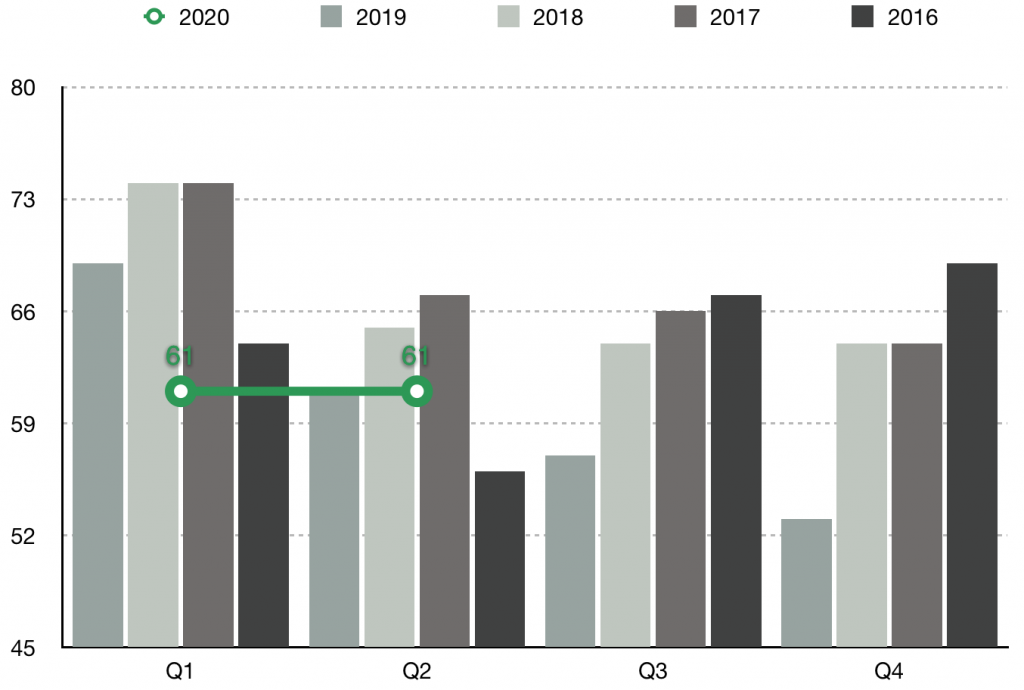
INVENTORY IS SLUGGISHLY MOVING
The average days on market in the Second Quarter idled at an average of 61 days.
Copyright © 2020 Snap Realty, LLC, All rights reserved.
Sources: GSREIN MLS Data for Residential Homes in Orleans Parish from 01/01/2014 – 7/2/2020 were used for values. All information is deemed reliable, but not guaranteed for accuracy. All data is subject to errors, omissions, revisions, and is not warranted. ©2020 Snap Realty, LLC.
All rights reserved. Equal Housing Opportunity.


